Build a radar controlled by ESP32
Tutorial plan
1- What is a radar ?
2- Operation of the radar controlled by ESP32:
3- Radar components
4- Radar mounting
5- Python Program
What is a radar ?
A radar (short for Radio Detection and Ranging) is a system that uses electromagnetic waves, specifically radio waves, to detect, locate, and track objects. It operates by transmitting radio waves and analyzing the signals that bounce back (echoes) after hitting an object. Here's a breakdown of its main components and functions:
Key Components
1- Transmitter: Generates radio waves and sends them into space.
2- Antenna:
Transmits the radio waves into a desired direction.
Receives the reflected waves (echoes) from objects.
3- Receiver: Processes the returned echoes to extract information.
4- Processor/Display Unit: Analyzes the data and displays it as images or signals for interpretation.
How Radar Works
1- Transmission: The radar emits a burst of radio waves.
2- Reflection: These waves travel through space, hit objects, and are reflected back toward the radar.
3- Reception: The radar antenna picks up the returning signals.
4- Processing: The time delay between transmission and reception, along with the strength of the reflected signal, helps calculate:
Distance to the object.
Speed of the object (using the Doppler effect).
Direction or bearing of the object.
Applications of Radar
Weather Monitoring: Detecting rain, storms, and other weather phenomena.
Air Traffic Control: Tracking and guiding aircraft.
Military: Detecting and tracking ships, planes, and missiles.
Maritime Navigation: Avoiding obstacles at sea.
Automotive: Advanced driver assistance systems like adaptive cruise control.
Space Exploration: Mapping surfaces of planets and moons.
Operation of the radar controlled by ESP32:
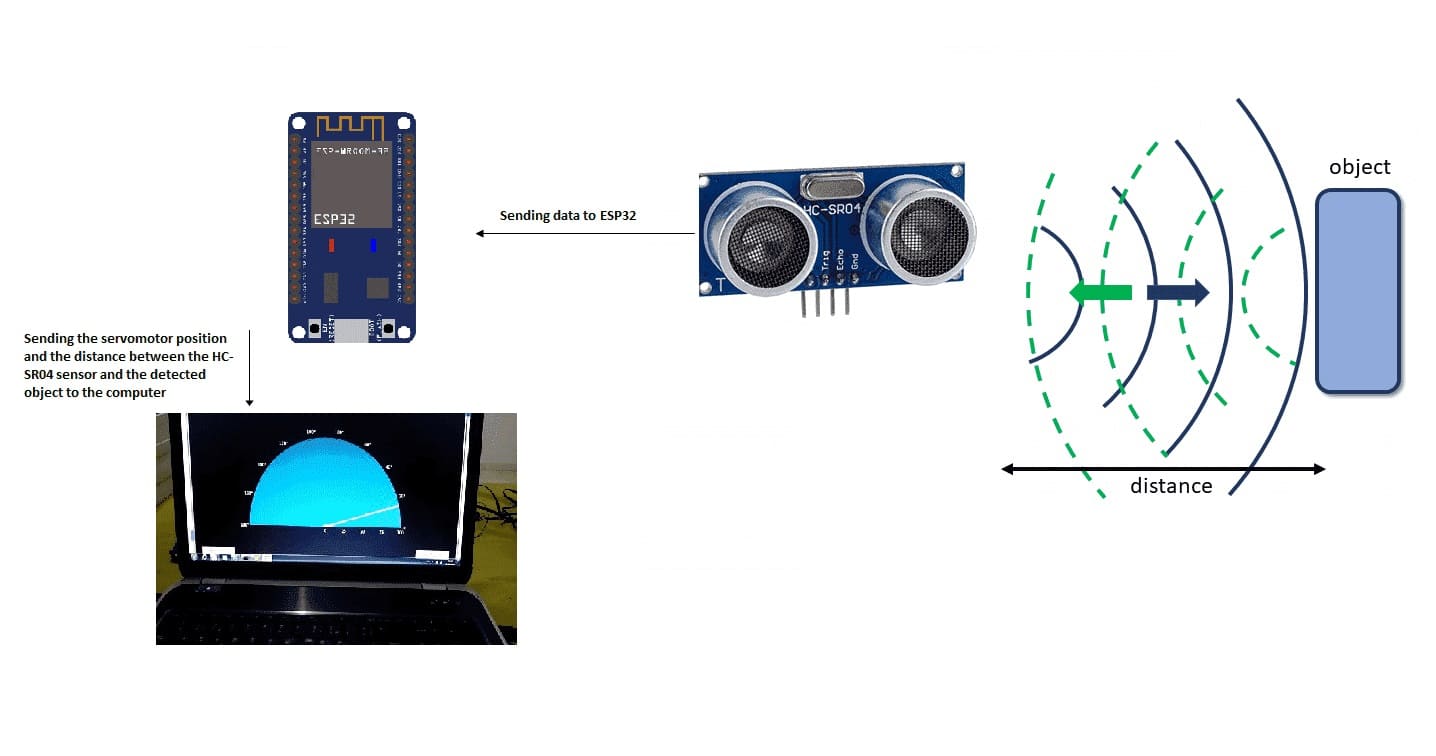
A radar system controlled by an ESP32 microcontroller, a servo motor, and an HC-SR04 ultrasonic sensor operates as a scanning or sweeping radar that maps its surroundings by detecting objects and measuring distances. Here's how it works:
1. Initialization:
The ESP32 initializes the servo motor and ultrasonic sensor.
It connects to the PC via USB or Wi-Fi, depending on the setup.
The PC runs visualization software (e.g., a Python script with libraries like Matplotlib or Processing for graphics).
2. Servo Scanning:
The ESP32 controls the servo motor to rotate the sensor incrementally over a specified range (e.g., 0° to 180°).
At each angle, the ESP32 pauses momentarily to allow the sensor to make an accurate distance measurement.
3. Distance Measurement:
- The HC-SR04 emits an ultrasonic pulse when triggered by the ESP32.
- It measures the time taken for the echo to return after bouncing off an object.
- The ESP32 calculates the object's distance.
4. Data Transmission:
The ESP32 sends the angle and measured distance to the PC in real time using serial communication (via USB or Wi-Fi).
5. Visualization:
- The PC software receives the data and plots it dynamically.
- A polar graph is typically used, where:
Angles represent the servo position.
Radii represent the measured distances.
- The screen updates continuously as the radar sweeps back and forth.
6. Continuous Scanning:
- Once the servo reaches its maximum angle (e.g., 180°), the ESP32 reverses the servo's direction for another sweep.
- The process repeats to create a continuous radar-like display.
Radar components
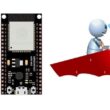
ESP32:
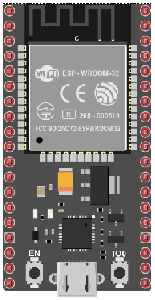
Controls the radar system, collects data from the HC-SR04, and sends it to the PC for display.
Servo Motor:

Rotates the HC-SR04 sensor to enable scanning over a range of angles.
HC-SR04 Ultrasonic Sensor:
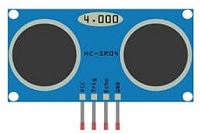
Measures distance by emitting ultrasonic waves and calculating the time it takes for the echo to return after bouncing off an object.
PC:

Displays the radar's data as a visual map (e.g., polar plot) via a connected program (like Python or Processing).
Radar mounting
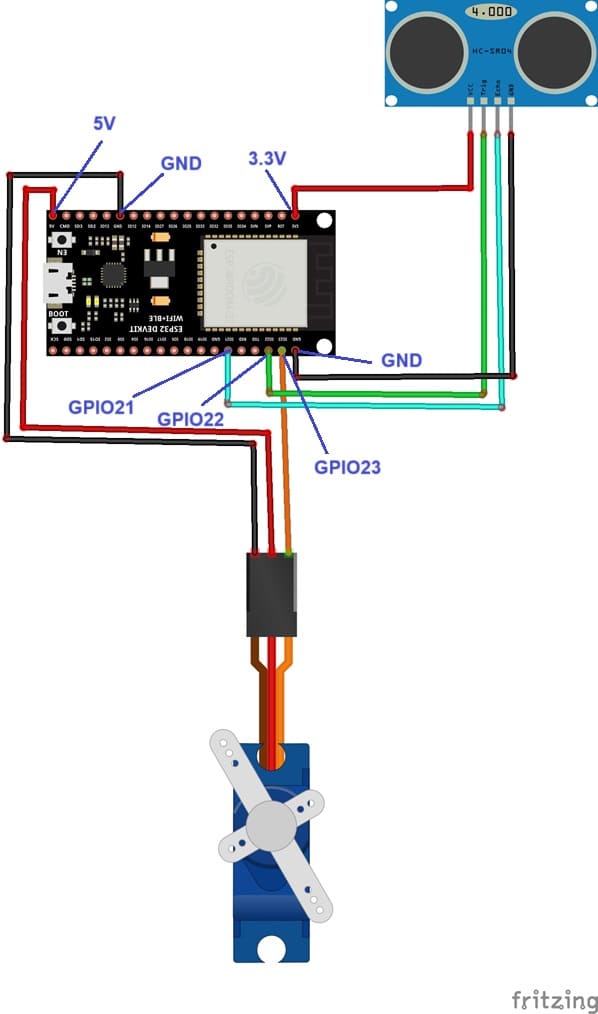
HC-SR04:
Connect the VCC and GND pins to the ESP32’s 3.3V and GND pins, respectively.
Connect the Trigger (TRIG) and Echo (ECHO) pins to GPIO22 et GPIO21 on the ESP32.
Servo Motor:
Connect the servo's power (usually red) to a 5V supply.
Connect the ground (black/brown) to the ESP32’s GND.
Connect the control (signal) wire (yellow/white) to GPIO23 pin on the ESP32.
Python Program
Here’s two programs with Python to control a radar system using an ESP32, a servo motor, an HC-SR04 ultrasonic sensor, and a PC for visualization.
Programming the ESP32 board with Micropython
Note: you must use these two libraries: hcsr04 and servo.
|
1 2 3 4 5 6 7 8 9 10 11 12 13 14 15 16 17 18 19 20 21 22 23 24 25 26 27 28 29 |
import machine from hcsr04 import HCSR04 from machine import UART,Pin from servo import Servo import utime # Initialize a UART objects uart = UART(2, baudrate=115200) sensor = HCSR04(trigger_pin=22,echo_pin=21,echo_timeout_us=1000000) servo_pin = machine.Pin(23) my_servo = Servo(servo_pin) delay = 0.01 min = 15 max = 165 count = 1 while True: for i in range(min,max): my_servo.write_angle(i) distance = sensor.distance_cm() if distance > 1000 : distance=0 print(i,',',distance) utime.sleep_ms(60) for i in range(max, min, -1): my_servo.write_angle(i) utime.sleep_ms(60) distance = sensor.distance_cm() if distance > 1000 : distance=0 print(i,',',distance) |
Python program executed by the computer
|
1 2 3 4 5 6 7 8 9 10 11 12 13 14 15 16 17 18 19 20 21 22 23 24 25 26 27 28 29 30 31 32 33 34 35 36 37 38 39 40 41 42 43 44 45 46 47 48 49 50 51 52 53 54 55 56 57 58 59 60 61 62 63 64 65 66 67 68 69 70 71 72 73 74 75 76 77 78 79 80 81 82 83 84 85 86 87 88 89 90 91 92 93 94 95 96 97 98 99 100 101 102 103 104 105 106 107 108 109 110 111 112 113 114 115 116 117 118 119 120 121 122 123 124 125 126 127 128 129 130 131 132 133 134 135 136 137 138 139 140 141 142 143 144 145 146 147 148 149 150 151 152 153 154 155 156 157 158 159 160 161 |
# Python + Arduino-based Radar Plotter # # ** Works with any motor that outputs angular rotation # ** and with any distance sensor (HC-SR04, VL53L0x,LIDAR) # import numpy as np import matplotlib matplotlib.use('TkAgg') import matplotlib.pyplot as plt from matplotlib.widgets import Button import serial,sys,glob import serial.tools.list_ports as COMs # # ############################################ # Find Arudino ports, select one, then start communication with it ############################################ # def port_search(): if sys.platform.startswith('win'): # Windows ports = ['COM{0:1.0f}'.format(ii) for ii in range(1,256)] elif sys.platform.startswith('linux') or sys.platform.startswith('cygwin'): ports = glob.glob('/dev/tty[A-Za-z]*') elif sys.platform.startswith('darwin'): # MAC ports = glob.glob('/dev/tty.*') else: raise EnvironmentError('Machine Not pyserial Compatible') arduinos = [] for port in ports: # loop through to determine if accessible if len(port.split('Bluetooth'))>1: continue try: ser = serial.Serial(port) ser.close() arduinos.append(port) # if we can open it, consider it an arduino except (OSError, serial.SerialException): pass return arduinos arduino_ports = port_search() #ser = serial.Serial(arduino_ports[0],baudrate=115200) # match baud on Arduino port1="COM4" ser = serial.Serial(port1,baudrate=115200) ser.flush() # clear the port # ############################################ # Start the interactive plotting tool and # plot 180 degrees with dummy data to start ############################################ # fig = plt.figure(facecolor='k') win = fig.canvas.manager.window # figure window screen_res = win.wm_maxsize() # used for window formatting later dpi = 150.0 # figure resolution fig.set_dpi(dpi) # set figure resolution # polar plot attributes and initial conditions ax = fig.add_subplot(111,polar=True,facecolor='#006d70') ax.set_position([-0.05,-0.05,1.1,1.05]) r_max = 100.0 # can change this based on range of sensor ax.set_ylim([0.0,r_max]) # range of distances to show ax.set_xlim([0.0,np.pi]) # limited by the servo span (0-180 deg) ax.tick_params(axis='both',colors='w') ax.grid(color='w',alpha=0.5) # grid color ax.set_rticks(np.linspace(0.0,r_max,5)) # show 5 different distances ax.set_thetagrids(np.linspace(0.0,180.0,10)) # show 10 angles angles = np.arange(0,181,1) # 0 - 180 degrees theta = angles*(np.pi/180.0) # to radians dists = np.ones((len(angles),)) # dummy distances until real data comes in pols, = ax.plot([],linestyle='',marker='o',markerfacecolor = 'w', markeredgecolor='#EFEFEF',markeredgewidth=1.0, markersize=10.0,alpha=0.9) # dots for radar points line1, = ax.plot([],color='w', linewidth=4.0) # sweeping arm plot # figure presentation adjustments fig.set_size_inches(0.96*(screen_res[0]/dpi),0.96*(screen_res[1]/dpi)) plot_res = fig.get_window_extent().bounds # window extent for centering win.wm_geometry('+{0:1.0f}+{1:1.0f}'.\ format((screen_res[0]/2.0)-(plot_res[2]/2.0), (screen_res[1]/2.0)-(plot_res[3]/2.0))) # centering plot fig.canvas.toolbar.pack_forget() # remove toolbar for clean presentation fig.canvas.set_window_title('Arduino Radar') fig.canvas.draw() # draw before loop axbackground = fig.canvas.copy_from_bbox(ax.bbox) # background to keep during loop ############################################ # button event to stop program ############################################ def stop_event(event): global stop_bool stop_bool = 1 prog_stop_ax = fig.add_axes([0.85,0.025,0.125,0.05]) pstop = Button(prog_stop_ax,'Stop Program',color='#FCFCFC',hovercolor='w') pstop.on_clicked(stop_event) # button to close window def close_event(event): global stop_bool,close_bool if stop_bool: plt.close('all') stop_bool = 1 close_bool = 1 close_ax = fig.add_axes([0.025,0.025,0.125,0.05]) close_but = Button(close_ax,'Close Plot',color='#FCFCFC',hovercolor='w') close_but.on_clicked(close_event) fig.show() ############################################ # inifinite loop, constantly updating the # 180deg radar with incoming Arduino data ############################################ # start_word,stop_bool,close_bool = True,False,False while True: try: if stop_bool: # stops program fig.canvas.toolbar.pack_configure() # show toolbar if close_bool: # closes radar window plt.close('all') break ser_bytes = ser.readline() # read Arduino serial data decoded_bytes = ser_bytes.decode('utf-8') # decode data to utf-8 #data =ser_bytes.decode('utf-8') print(decoded_bytes) data = (decoded_bytes.replace('\r','')).replace('\n','').replace(' ','') #print(data.split(',')) if start_word: vals = [float(ii) for ii in data.split(',')] print(vals) if len(vals)<2: continue angle,dist = vals # separate into angle and distance if dist>r_max: dist = 0.0 # measuring more than r_max, it's likely inaccurate dists[int(angle)] = dist if angle % 5 ==0: # update every 5 degrees pols.set_data(theta,dists) fig.canvas.restore_region(axbackground) ax.draw_artist(pols) line1.set_data(np.repeat((angle*(np.pi/180.0)),2), np.linspace(0.0,r_max,2)) ax.draw_artist(line1) fig.canvas.blit(ax.bbox) # replot only data fig.canvas.flush_events() # flush for next plot else: if data=='Radar Start': # stard word on Arduno start_word = True # wait for Arduino to output start word print('Radar Starting...') else: continue except KeyboardInterrupt: plt.close('all') print('Keyboard Interrupt') break |
